


Power BI
Solutions
Implementing Power BI
Power BI is a powerful business analytics platform for collecting, processing, and visualizing data from various systems in the form of clear management reports and dashboards. It is suitable for medium and large businesses where data is stored in multiple sources, regular management reporting is required, and decisions are made based on actual metrics rather than disparate spreadsheets.
AvadaCRM views Power BI implementation as an engineering and consulting project focused on metric reproducibility, data control, and analytics development without rebuilding the architecture as the business grows.

What is Power BI?
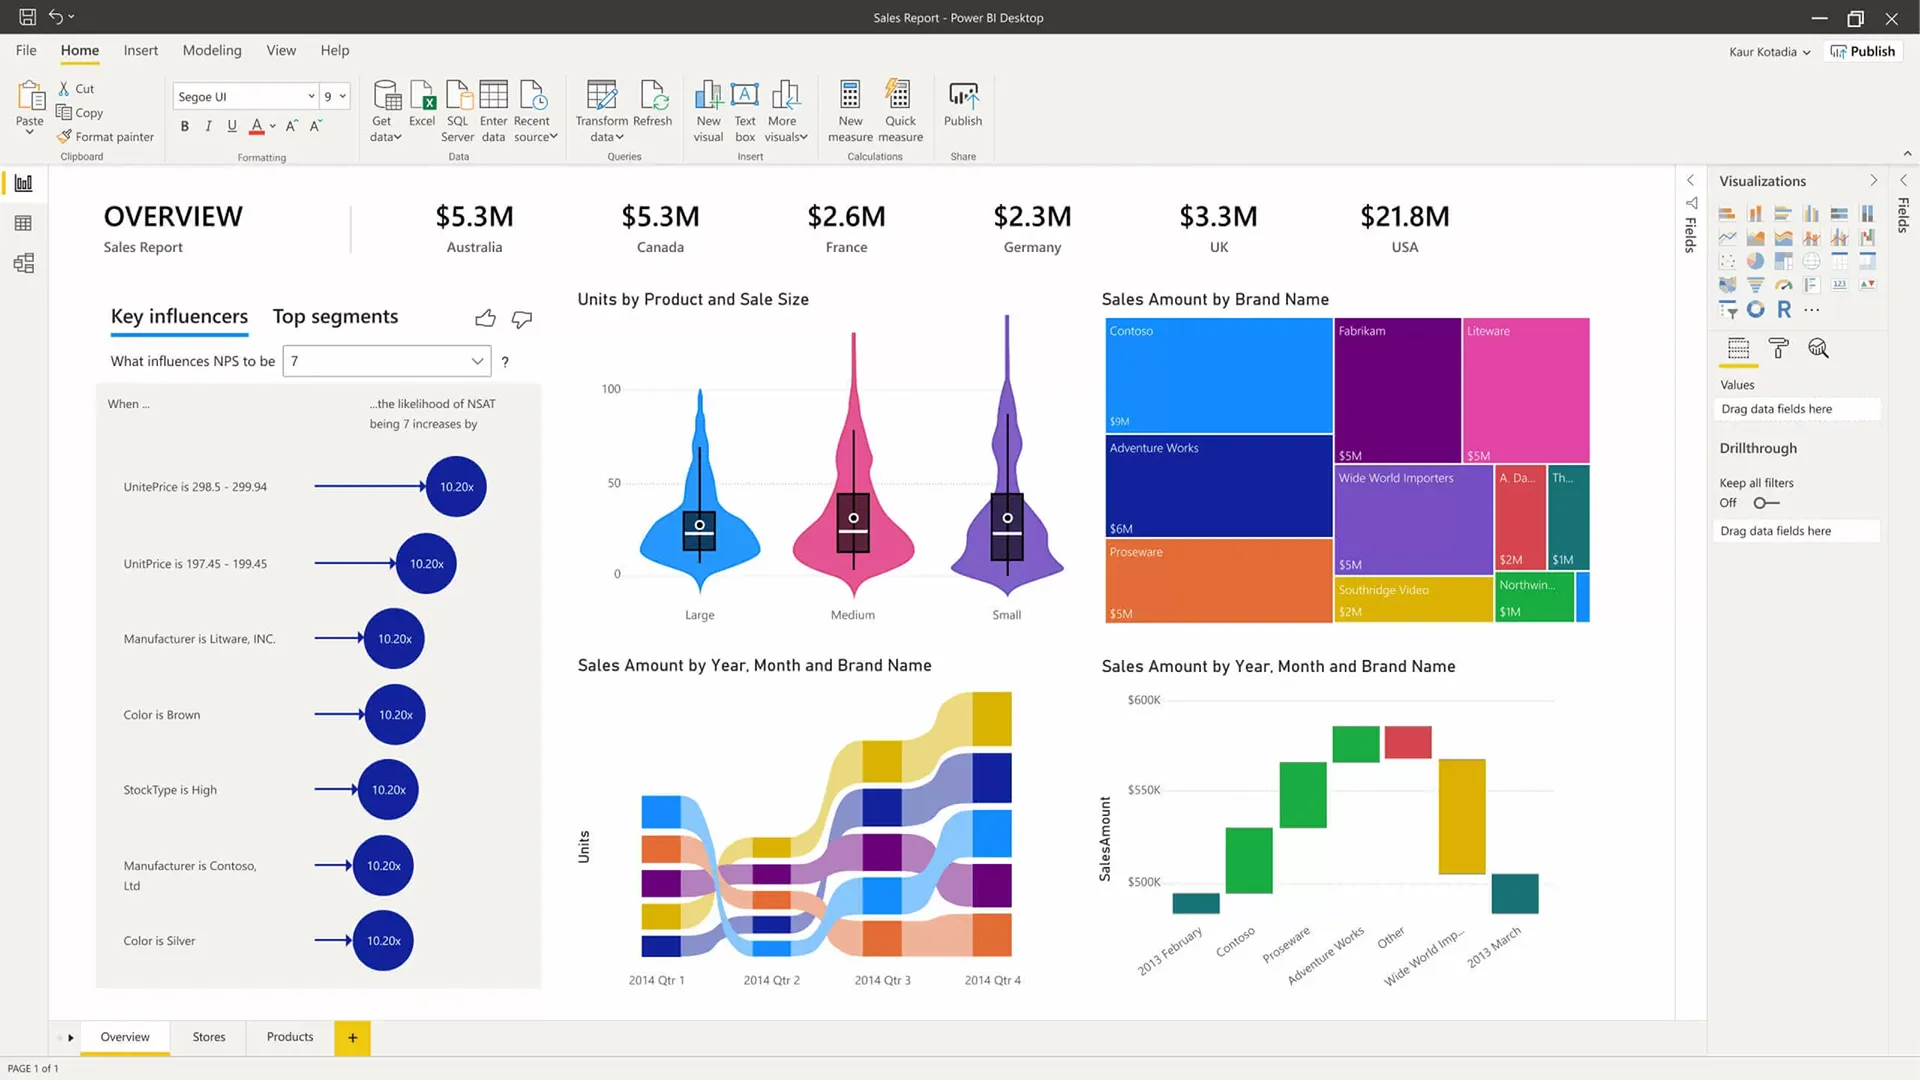
Power BI is a business analytics platform from Microsoft designed to collect, process, analyze, and visualize data from various sources in the form of interactive reports and dashboards. Power BI's primary goal is to provide executives and teams with a clear, near-real-time view of their business .
Main components:
- Power BI Desktop - developing data models and preparing reports;
- Power BI Service - cloud publishing, collaboration, and access management;
- Power BI Gateway - sync on-premises sources with the cloud.
- A single data model ensures consistency, reproducibility and a single source for all analytical processes;
- Reports, dashboards and datasets provide various types of analytics for executives, analysts and operations teams;
- Cloud and hybrid architecture allows the system to scale by combining local and cloud sources and maintaining continuous data updates;
- Integration with Microsoft 365 and Azure provides end-to-end data access, enterprise application integration, and analytics platform extensibility.
The platform works particularly effectively with Microsoft Dynamics 365 thanks to the unified Microsoft ecosystem, but also supports integration with any other CRM and external systems, allowing you to combine data from different sources and build comprehensive analytics.


What tasks does the implementation of Power BI solve?
The platform addresses key management and operational tasks, including management analytics, financial reporting, KPI monitoring, sales analytics, operational analytics, supply chain analysis, and BI for top management.
Companies often face disparate data sources, inconsistent metrics, and slow access to analytics. Power BI allows you to combine data from various systems, create a unified model, and customize visualizations for different management levels. This eliminates manual calculations, accelerates decision-making, and provides metrics transparency across all departments.
The platform supports large data volumes, customizable KPIs, and automated calculations via DAX and Power Query, making analytics manageable and accurate, and business processes controllable.
Who is Power BI suitable for?
The platform is designed for organizations where data is already formed but not used as a single management resource. It is used where system analytics is required on top of the existing IT structure.
Ideal for:
- Medium and large businesses, including holdings and groups of companies;
- Companies with a distributed structure and several legal entities;
- Businesses with large volumes of historical data from ERP, CRM and industry systems;
- Organizations focused on making data-driven management decisions;
- Industries with a high analytical load: finance, retail and e-commerce, logistics, manufacturing, distribution, telecom and service companies.
The platform does not replace ERP or CRM systems and does not generate data. It leverages information from existing systems, creating a manageable analytical model for all management levels.

Power BI Implementation Steps
The process of implementing an analytical platform is structured as a sequential engineering project, in which each stage solves its own problem and builds on previous results.
Key stages of the project:
- Analytics and data audit - analysis of sources, data structure, quality of indicators, and business expectations from analytics.
- Designing a BI architecture involves creating a target data flow diagram, scaling principles, and integration with existing systems.
- Building a data model is the creation of a unified analytical model with business logic, hierarchies, and aggregation rules.
- Setting up Power Query and DAX - preparing data and implementing calculations required for management analytics.
- Developing reports and dashboards – creating an analytical layer for different user roles.
- Security configuration (RLS) - restricting access to data in accordance with roles and corporate requirements.
- Publishing and access management - publishing analytics and setting up user rights.
- User training – preparing key employees to work with the analytical platform.
- Maintenance and development – adapting analytics to business changes without revising the underlying architecture.
Power BI architecture
The platform's architecture is built around data integration, preparation, and secure use in BI. Sources can include SQL and NoSQL databases, ERP and CRM systems, Excel, SharePoint, Azure SQL, Synapse, Dataverse, and external APIs.
Data processing is implemented through ETL/ELT using Power Query, enabling transformation, cleansing, and merging of data before loading it into the model. The data model provides unified business logic, calculated metrics, and managed data access.
The DAX layer enables the calculation of KPIs, complex metrics, and indicators for management analysis. The visual layer provides reports, dashboards, and datasets for different roles and management levels.
Security and access control are implemented through Row-Level Security, roles, and tenant settings, ensuring publication control and compliance with corporate governance requirements.
Power BI Integrations
Power BI integration covers a wide range of corporate and external systems. The platform connects to SQL, PostgreSQL, and MySQL databases, ERP and CRM systems, including Microsoft Dynamics 365, and also supports Excel and SharePoint for existing files and collaborative workspaces.
For cloud scenarios, connections to Azure SQL and Synapse, as well as various APIs and external services, are used. Dataverse provides a unified data warehouse and integration with Microsoft Power Platform applications. This Power BI integration enables end-to-end analytics, centralized data management, and process automation within a unified BI environment, ensuring continuous data updates and access to relevant information across all departments.
AvadaCRM team can implement all necessary integrations, ensuring proper connection and configuration of the platform for business needs.

Security and access management
Security and access control are implemented through:
- Row-Level Security (RLS) - restricting the visibility of data at the row level depending on the user's role;
- Roles - managing access rights of users and groups to analytical data;
- Tenant settings - control over global security parameters and platform usage;
- Publishing Control - Manage who can publish and distribute reports and dashboards;
- Governance – compliance with corporate rules, regulations, and analytics requirements.
This approach ensures data protection, compliance with corporate and regulatory requirements, and reduces the risk of uncontrolled dissemination of analytical information.
The result of a properly implemented Power BI
The result of a properly implemented Power BI is more than just beautiful dashboards, but a controlled, data-driven decision-making system. Below are the key benefits a business achieves with proper architecture and implementation.
Single Source of Truth
- All data is consolidated from CRM, ERP, accounting, marketing, and warehouses.
- Discrepancies in figures between departments are eliminated.
- Management and teams work with the same indicators and calculation logic.
Result: disputes about “whose numbers are correct” disappear.
Transparent KPIs in real time
- Sales, finance, marginality, funnel, debt, inventory.
- Data is updated automatically, without Excel or manual reports.
- KPIs are linked to roles: CEO, CFO, Head of Sales, Operations.
Result: business management “here and now”, not based on the results of the month.
Rapid management decision-making
- Drill-down: from a general metric to a specific customer, transaction, or SKU.
- Comparison of periods, plan/actual, deviations.
- Early identification of problems and growth points.
Result: decisions are made in minutes, not days.
Reducing operating costs
- Reduction of manual reporting and Excel files.
- Fewer errors due to human factors.
- Saving time for analysts, accountants, and managers.
Result: Power BI pays for itself by freeing up resources.
Control and responsibility
- Clear accountability for performance indicators across departments and employees.
- It is clear where the process “breaks down”: sales, logistics, finance.
- Data historicality and audit of changes.
The result: control instead of chaos.
Scalability and development
- Adding new data sources without redesigning the system.
- The company's growth does not break analytics.
- Possibility of transition from reports to forecasting (forecast, ML).
Result: analytics grows along with the business.
Key takeaway
Properly implemented Power BI means:
- not reports, but a management platform;
- not visualization, but control and forecast;
- Not an IT toy, but a tool for CEOs and owners.
If Power BI is implemented formally, you get charts. If implemented correctly, you get data-driven business management.


Power BI Support and Development
After implementation, it's important to maintain the relevance and effectiveness of the analytics platform. Support includes regular data updates, functionality development, and analytics quality control.
Main areas of support:
- Microsoft updates;
- development of the data model;
- connection of new sources;
- control of the correctness of indicators;
- scaling without changing the basic architecture.
AvadaCRM team provides support for Power BI at every stage, maintaining the stability, development, and manageability of the analytical system.
Order Power BI implementation
When implementing or optimizing a BI system, it's important to begin with an analysis of the architecture, data sources, and analytical model, taking into account business processes and scalability. An effective solution begins with an audit of data and key metrics, not with report customization.
AvadaCRM provides managed implementation of analytics platforms and helps you build a unified data source. We're ready to discuss your project and offer a technically sound solution.


FAQ
-
How long does it take to implement an analytics platform?
The timeframe for implementing an analytics platform depends on the scale and maturity of the data, but on average it looks like this:
- Audit and design - 1-2 weeks
- Connecting sources and data model - 2-4 weeks
- Dashboard and KPI development — 1–3 weeks
- Testing and launch - 1 week
Total: 4 to 8 weeks for most projects.
In the presence of complex architecture, distributed systems or non-standardized data, the deadlines may increase and are clarified after the initial audit.
-
Can I use existing reports and data?
Yes. Current sources, models, and reports are analyzed and, if necessary, integrated into the target architecture without data loss.
-
Is the platform suitable for a large number of users?
The architecture is designed to scale and handle tens and hundreds of users while maintaining performance and manageability.
-
How is data security ensured?
Role mechanisms, Row-Level Security, tenant settings and corporate access policies that meet governance requirements are used.
-
Is it possible to develop analytics after launch?
Yes. The data model and architecture are designed with future expansion, adding metrics and sources in mind.
-
Is user training required?
Training is recommended for key users and analysts to ensure correct data interpretation and independent operation of the system.
-
What is the best way to start a project?
The optimal starting point is an analytics audit and architecture consultation to assess risks and define a target model.